Payment Trends and COVID
Many firms discuss the impact of COVID-19 on various aspects of businesses, but few have access to consumer data across industries to look at trends. VION initiated an investigative review of the COVID-19 pandemic on “performing” non-bank consumer accounts receivable, primarily focusing on the fiscal stimulus impact and on-going recessionary effects. A range of U.S. based retailers offering proprietary consumer financing options for the purchase of both durables and discretionary merchandise shared data with VION for this report. Buoyed by the federal stimulus programs, overall performance results through August 2020 were generally positive with elevated credit payment rates and stable delinquency levels. Payment modifications offered to customers with pandemic related financial hardships were predominately limited to the second quarter of 2020. Non-bank credit sales presented somewhat of a mixed bag in 2020. State-by-state differences in “non-essential” retail store closure mandates and consumer spending trends, because of quarantining, proved a windfall for some companies with others languishing. The results provided short-term relief to business owners and asset-based lenders utilizing consumer receivable assets in a collateralized loan. However, uncertainty regarding consumer credit remains pervasive with CARES Act funding drying up, stubbornly high and increasing unemployment rates, and COVID-19 resurging.
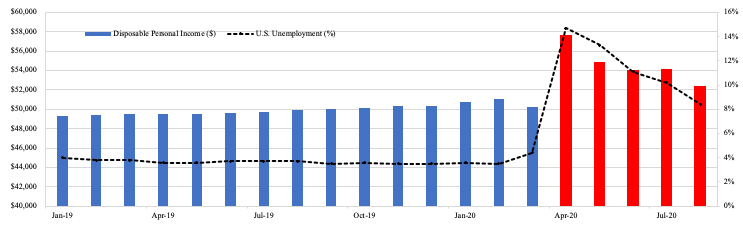
Congress’s $2.2T CARES Act stimulus package intended to stimulate consumer spending and support the general economy in addition to providing liquidity to consumers also temporarily halted foreclosures, evictions, and student loan payments. In total, the IRS made 159 million individual payments worth $265 billion with the intent to energize the economy, which shrank by 9.5% in the second quarter1. The fiscal injection increased average disposable income per capita by 9.9% from April 2020 to August 2020 compared to the prior year (Figure 1). Stimulus payments targeted both low and middle-income groups, both demographics highly representative in VION’s research data, but the package proved a boon for the highest risk individuals suffering from job loss or furlough. A survey by the Federal Reserve found that 40% of unemployment insurance recipients reported earning more in benefits than their previous wages, and the percentage increases to 56% for low-income families earning less than $40,0002. Democrats and Republicans are unlikely to agree on another stimulus package prior to the election and major industries, such as amusement parks and airlines, have announced upcoming layoffs. Consequently, disposable income is expected to continue declining for the remainder of 2020 as federal stimulus payments slow and pandemic-related assistance programs begin to wind-down.
Figure 1: U.S. Disposable Personal Income Per Capita: Current Dollars
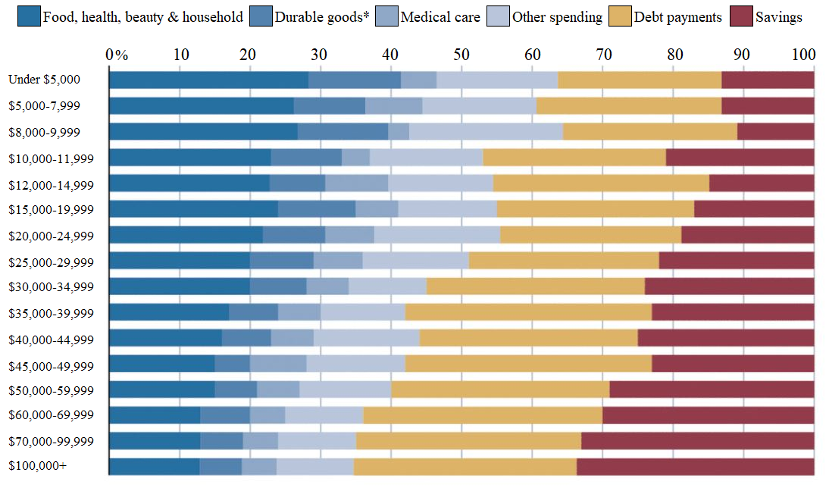
So where was the extra money spent? A recent study National Bureau of Economic Research indicates individuals did not use stimulus payments quite as Congress had intended. The study found only 42% spent the money, 27% saved it and the remaining 31% repaid debts (Figure 2)3. The data reveals that 30% of individuals spent their entire stimulus payment while 40% did not spend any. The results may have been disappointing to lawmakers hoping to boost consumption, but credit issuing retailers, investors, and debt buyers found the results encouraging. Debt collectors reported record profits in the first two quarters of 2020, a task simplified by the fact delinquent borrows were quarantined at home with a pocket full of cash and no place to spend it. Additionally, non-bank consumer credit retailers reported a significant increase in monthly payments rates compared to 2019 as customers paid down outstanding consumer debt obligations. The effect is characteristic of credit account paydowns typically realized by retailers during the income tax refund season. The increase in consumer receivable portfolio collections was not offset by new sales financing during the periods for many retailers. As such, draw-downs declined and senior debt liability repayments went up, decreasing receivable portfolio balances over the previous six months and reducing collateral availability for many asset-backed loans and revolving credit facilities. Good news for lenders who are more than happy to reduce their balance sheet credit risk exposure right now.
Figure 2: U.S. Stimulus Payment Usage by Household Income
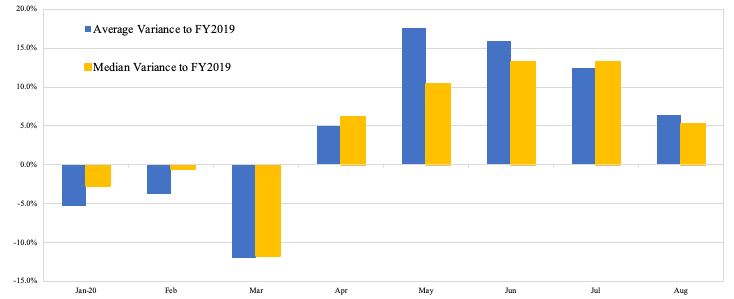
Conclusions: First, stimulus payments significantly enhanced non-bank consumer credit payment rates4 from April to August 2020 compared to the equivalent 2019 period (Figure 3). The increase in monthly collection rates was muted in April, averaging 5%, with a scattered deviation between various retailers in the sample. However, the median payment rate variance increased to 10% in May and 13% in June and July as nearly all reviewed retailers reported a jump in monthly credit account payments and many companies reporting advances of 15% to 20% or more. Supplementary unemployment insurance payments of $600 per week phased-out on July 31st and was replaced by a federal jobless aid mandate, extending benefits at a reduced rate of $300. This helped keep August non-bank consumer payment rates 5% over the prior year, although the additional money is running out with many states already reporting a full depletion of available funds. Sampled retailers are reporting year-to-date August 2020 credit payment results in excess of 2019, offsetting depressed collections in January and February due to seasonality and March as the pandemic took affect and unemployment skyrocketed. Several retailers offered payment relief to certain high-risk customers in the form of payment deferrals or interest accrual moratoriums, but such modifications were generally limited to the second quarter 2020.
Figure 3: Non-Bank Consumer Credit Payment Rate Comparision
Second, non-bank consumer credit originations over the prior six months varied considerably by retail segment. Companies selling merchandise related to home furnishings, appliances, and other durable goods fared well as quarantined consumers looked to establish home offices, provide in-home schooling, and redecorate homes. Retailers with an online presence, including discretionary merchandise, outperformed brick-and-mortar only companies due to various quarantine mandates, closures of “non-essential” retailers, and general trepidation of consumers about going out in public as the pandemic persists.
Finally, uncertainty regarding additional federal stimulus packages, looming layoffs, and a persistent unemployment rate are anticipated to hit non-bank consumer credit retailers in fourth quarter 2020. Delinquency results in August suggest a general increase in early-stage delinquency for non-bank consumer receivables with payment rates expected to normalize to 2019 levels or deteriorate in the fourth quarter as the various CARES Act provisions expire. Reported charge offs remained consistent to 2019 throughout the pandemic but may experience a substantial increase in early 2021 as distressed customers progress further delinquent.
Congress threw the American consumer a life raft early on, but dry land is still far off as the pandemic winds still blow.
Footnotes
- Current-dollar U.S. GDP decreased from $21.56 trillion in Q12020 to $19.52 trillion in Q22020. Bureau of Economic Analysis GDP release (third-estimate); September 30, 2020
- Federal Reserve “Update on the Economic Well-Being of U.S. Households: July 2020 Results”
- Olivier Coibion, Yuriy Gorodnichenko, and Michael Weber, “How Did U.S. Consumers Use Their Stimulus Payments?”; National Bureau of Economic Research
- Total monthly credit account payments (net) as a percentage of total outstanding portfolio receivables (beginning of month)